This is a major revision of Database Tracing In English:
Update - August 6, 2012: To read about another developer's experience, see "Email from a developer" at the bottom of this article.
- with pictures this time,
- and more details
- including steps to create a separate tracing database
- and instructions for saving the captured graphical plans in *.saplan files for sending to other people
- or posting on the SQL Anywhere Forum.
Step 1. Start your application database with -x tcpip specified. Database Tracing needs TCP/IP even if you normally use Shared Memory, and if you forget to specify -x tcpip here you will eventually get the dreaded message "ATTACH TRACING could not connect to the tracing database".
Also, don't specify the -sb 0 option. If you do specify -sb 0, or forget -x tcpip, you'll be coming back here to Step 1 and starting over.
For the purposes of this demonstration, a brand-new empty SQL Anywhere 11 database will do just fine; here's a command file to set one up:
"%SQLANY11%\bin32\dbinit.exe"^
  ddd11.db

"%SQLANY11%\bin32\dbspawn.exe"^
  -f^
  "%SQLANY11%\bin32\dbeng11.exe"^
  -o dbeng11_log_ddd11.txt^
  -oe dbsrv11_log_fatal_ddd11.txt^
  -x tcpip^
  ddd11.db

"%SQLANY11%\bin32\dbisql.com" ^
  -c "ENG=ddd11;DBN=ddd11;UID=dba;PWD=sql;"
Step 2. Start Sybase Central 11.
Step 3. Connect to your application database.
Step 4. See the "Mode" item appear in the menu bar.
Design Flaw 1: The "Mode" item should always appear in the menu bar so folks won't go wandering around the GUI in a fruitless search for hidden functionality. It should also be enabled, even if you're not connected to a database, because you might want to view the results from a previous tracing session and for that you don't need no steenking connection to your application database. At this point in this demo, however, it doesn't matter because you are going to use the database you connected to in Step 3.
Step 5. Ignore the "Mode" item. Instead, right-click on the grey "oil drum" icon that represents your database in the left pane, and click on "Tracing..."

Step 6. See the "Database Tracing Wizard" window appear.
If you don't see the "Database Tracing Wizard" window appear, but you do see another menu level under "Tracing...", click on "Clear tracing levels" to get rid of any old data, then go back to Step 5 to click on "Tracing...".
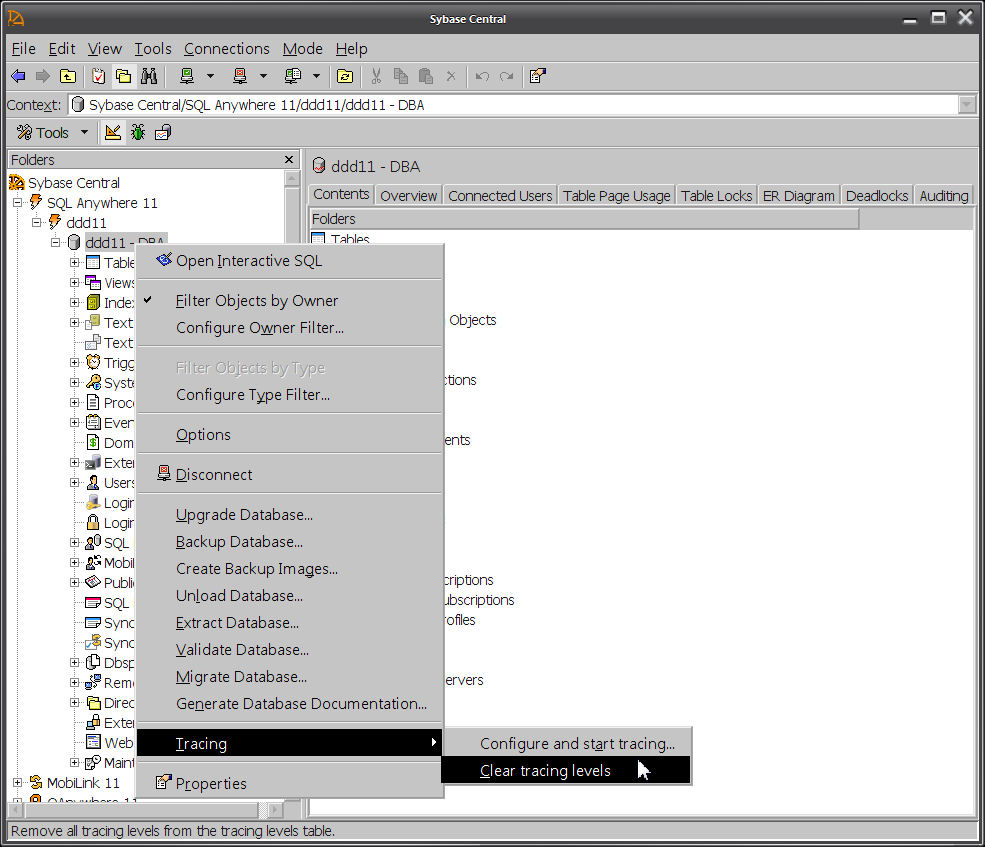
Design Flaw 2: Menus should have fixed layouts without items and submenus that appear and disappear. If an item isn't available for use it should be greyed out... but not invisible... it's hard to learn how something works ifHere's what you want to see:crapstuff keeps appearing and disappearing.
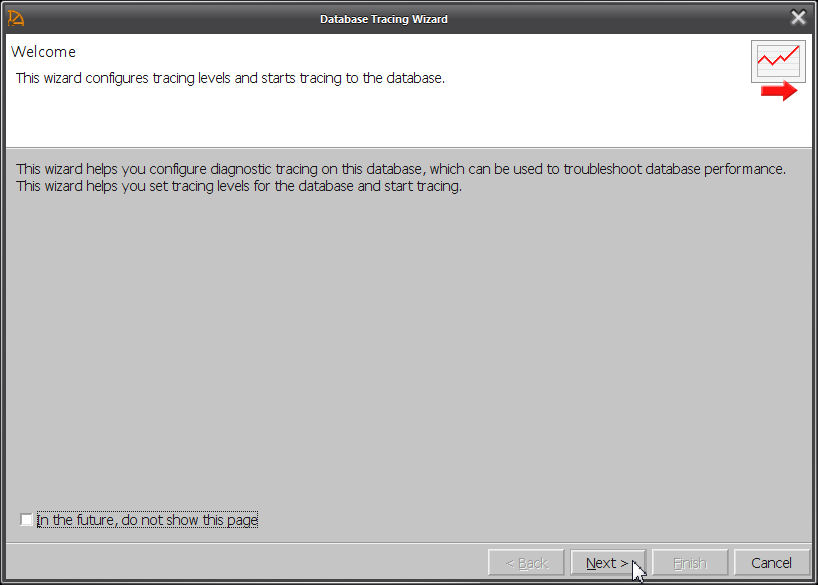
Step 7. Click on "Next".
Step 8. See the "Tracing Detail Level" window appear.
Step 9. Check "Custom - select all levels manually (recomended for advanced users)".
Step 10. Click on "Next".
Step 11. See the "Edit Tracing Levels" window appear.
Step 12. Click on "New...".
Step 13. See the "Add Tracing Level" dialog box appear.
Step 14. Choose these values (they are the defaults):
Scope: database
Tracing type: plans_with_statistics
Condition: none
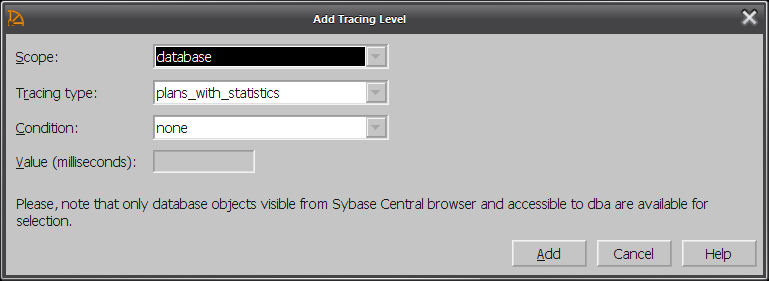
Step 15. Click on "Add".
You can add other tracing levels if you want, but "plans_with_statistics" is the important one... if you don't include that one, there's not much point in continuing.
Step 16. Click on "Next".
Step 17. See the "Create External Database" window appear.
Step 18. Check "Create a new tracing database".
Step 19. Provide a file specification for the tracing database; in this example it is C:\$ blogs and websites\blog SQLAnywhere\20110518 Database Tracing In xx Easy Steps\tracing.db
Step 20. Fill in these fields:
User name: dba
Password: sql
Confirm password: sql
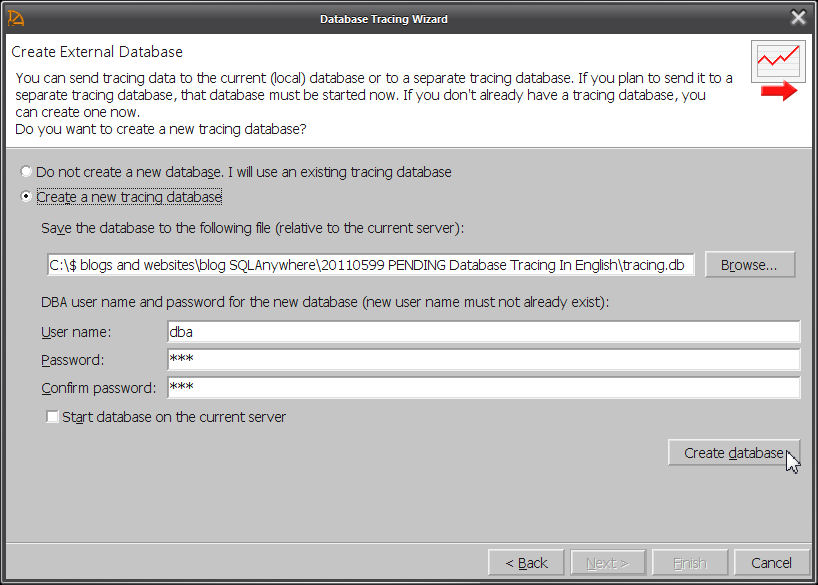
Design Flaw 3: The on-screen exhortation "(new user name must not already exist)" should be omitted because it's confusing... nothing exists already, it's a new database.
Step 21. Click on "Create database".
Step 22. See the "Creating Tracing Database" progress window appear and disappear.

Step 23. When control returns to the "Create External Database" window, click on "Next".
Step 24. See the "Start Tracing" window appear...
...but wait, don't click on anything yet.
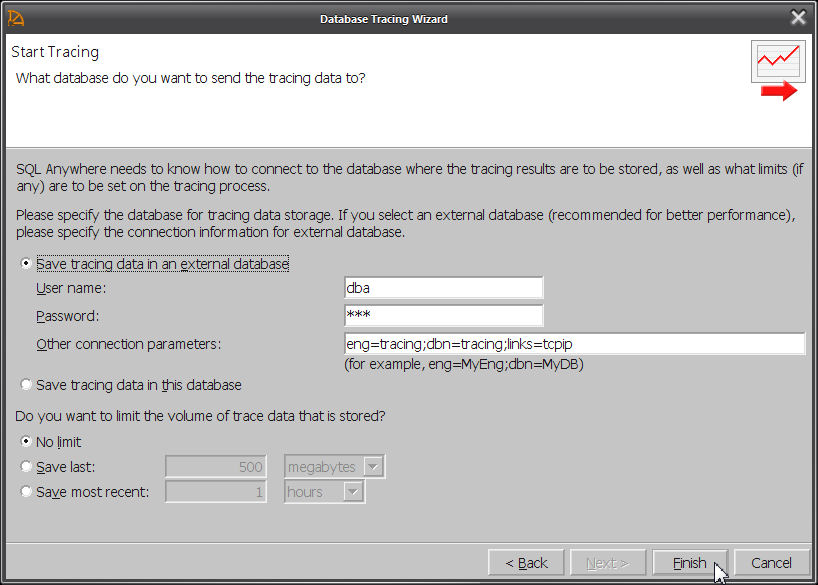
Step 25. At this point, you need to start the new tracing database in an engine of its own... I think there is a way to get Sybase Central to do this for you, but I haven't figured how. The "Start Tracing" window doesn't seem to actually start the tracing database, it just starts the tracing activity by connecting to a running tracing database.
Here's a command file to start the new tracing database and an ISQL session which will be needed later:
"%SQLANY11%\bin32\dbspawn.exe"^
  -f^
  "%SQLANY11%\bin32\dbeng11.exe"^
  -o dbeng11_log_tracing.txt^
  -oe dbeng11_log_fatal_tracing.txt^
  -x tcpip^
  tracing.db

"%SQLANY11%\bin32\dbisql.com" ^
  -c "ENG=tracing;DBN=tracing;UID=dba;PWD=sql"
Step 26. Check and possibly edit the connection information on the "Start Tracing" window.
Step 27. Click on "Finish".
You might get an error at this point "ATTACH TRACING could not connect to the tracing database". If you do, try fiddling around with the connection parameters, maybe adding a LINKS=TCPIP(HOST=localhost;PORT=xxxx). Make sure you did specify -x tcpip when you started the application database in Step 1 and the tracing database in Step 25.
Oh, and if you're application database was started with -sb 0 specified, take that out and start over.
Step 28. See the Sybase Central window get control... it's almost as if nothing is happening, but it is, behind the scenes.
Have a look at the console window for your application database, you'll see these messages:
Diagnostic tracing has been started
Diagnostic tracing is being sent to 'UID=dba;PWD=********;DBN=tracing;ENG=tracing;LINKS=tcpip'
Step 29. Switch over to ISQL, or your application, whatever, and run your test(s).
For the purposes of this demonstration, it's important to run the same slow-moving query at least twice. The reason for this is to show how the Database Tracing display summarizes multiple runs of the same query and requires you to drill down to individual executions of that query before displaying the plans.
Here's a query that should take some time even in an empty database; run it at least twice:
SELECT 'query 1',
       SYSTABCOL.domain_id,
       COUNT(*)
  FROM SYSTABCOL
          CROSS JOIN SYSTAB
          CROSS JOIN SYSGROUP
 GROUP BY SYSTABCOL.domain_id
 ORDER BY SYSTABCOL.domain_id;
If that query isn't slow enough for you, try this one, but make sure you run the exact same query at least twice:SELECT 'query 2',
SYSTABCOL.domain_id,
COUNT(*)
FROM SYSTABCOL
CROSS JOIN SYSTABCOL AS b
CROSS JOIN SYSGROUP
GROUP BY SYSTABCOL.domain_id
ORDER BY SYSTABCOL.domain_id;
Step 30. When you're done running your test(s), switch back to Sybase Central.
Step 31. Right-click on the database icon in the left pane, and click on "Tracing - Stop tracing with save".
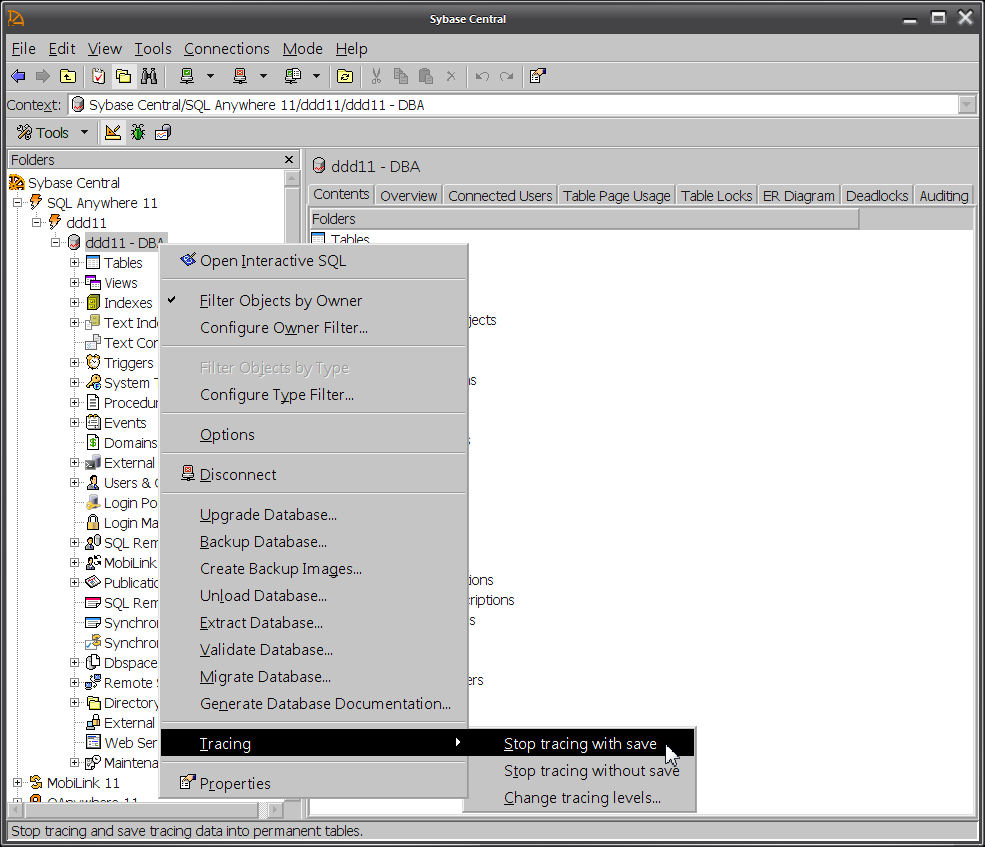
Step 32. See the "Stop Tracing With Save" progress window appear and disappear.

Step 33. When control returns to Sybase Central, if you don't see the "Application Profiling" item on the menu bar, click on "Mode - Application Profiling" to get it to appear.
Design Flaw 4: The same name should never be used for two different menu items in two different locations. A whole generation of developers has been trained to believe polymorphism is a good idea but that doesn't make it true... identically named but different menu items are just confusing.
Design Flaw 5: The "Application Profiling" menu item should always be visible, and it should always be enabled. It's hard enough navigating this GUI without random changes... this is not a video game. In fact, the "Mode" menu item should probably not exist at all... modes suck, always have, always will.
Step 34. Now click on "Application Profiling", the item up on the main menu bar, and then "Open Analysis file or Connect to a Tracing Database":

Step 35. See the "Open Analysis Or Connect To Tracing Database" window appear.
Step 36. Check "In a tracing database" and click on "Open".
Step 37. See the "Connect to a Tracing Database" dialog box appear.
Step 38. Fill in the connection information for your tracing database (not your application database, but your new tracing database):
Identification tab - User ID: dba
Identification tab - Password: sql
Database tab - Server name: tracing
Database tab - Database name: tracing
Step 39. Click on "OK".
Step 40. The "Application Profiling Details" pane should appear in Sybase Central.
If it doesn't appear, try clicking on "View - 1 Application Profiling Details".

Step 41. Make a note of the "Logging session ID" value, in this case 1; later on this will make it possible to save the plan in a *.saplan file.
Step 42. Click on the "Database Tracing Data" tab at the bottom of the window to see a list of all the queries that have been captured. This is the summary view, where multiple executions of the same query appear on one line.
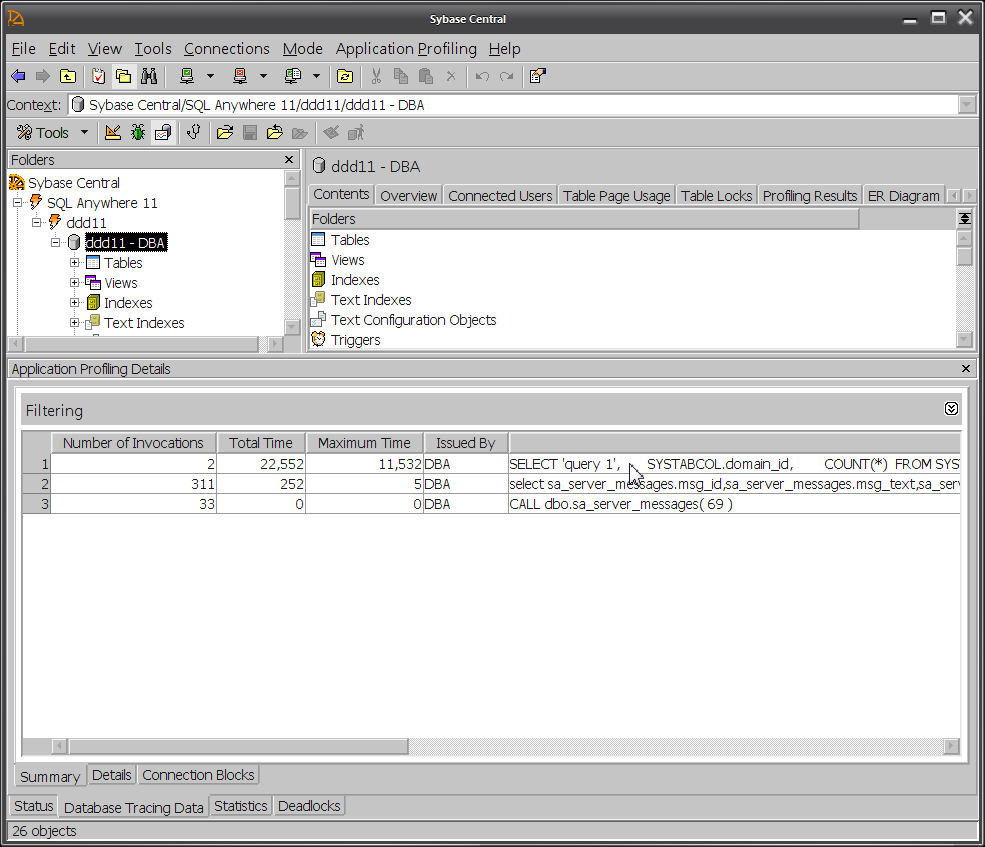
Step 43. Select the query you are interested in and click on right-mouse "Show the Detailed SQL Statements for the Selected Summary SQL Statement".

Step 44. See the "Details" tab showing the drill-down view of the two separate executions of the same query. This is where you have to get to before seeing the plans.
Step 45. Select one of the executions and click on right mouse - "View More SQL Statement Details for the Selected Statement"

Step 46. See the "SQL Statement Details" window appear.

Step 47. Make a note of the "Request ID" value, in this case 1563; later on this will make it possible to save the plan in a *.saplan file.
Step 48. Click on the "Query Information" tab at the bottom of the "SQL Statement Details" window to see the graphical plan.
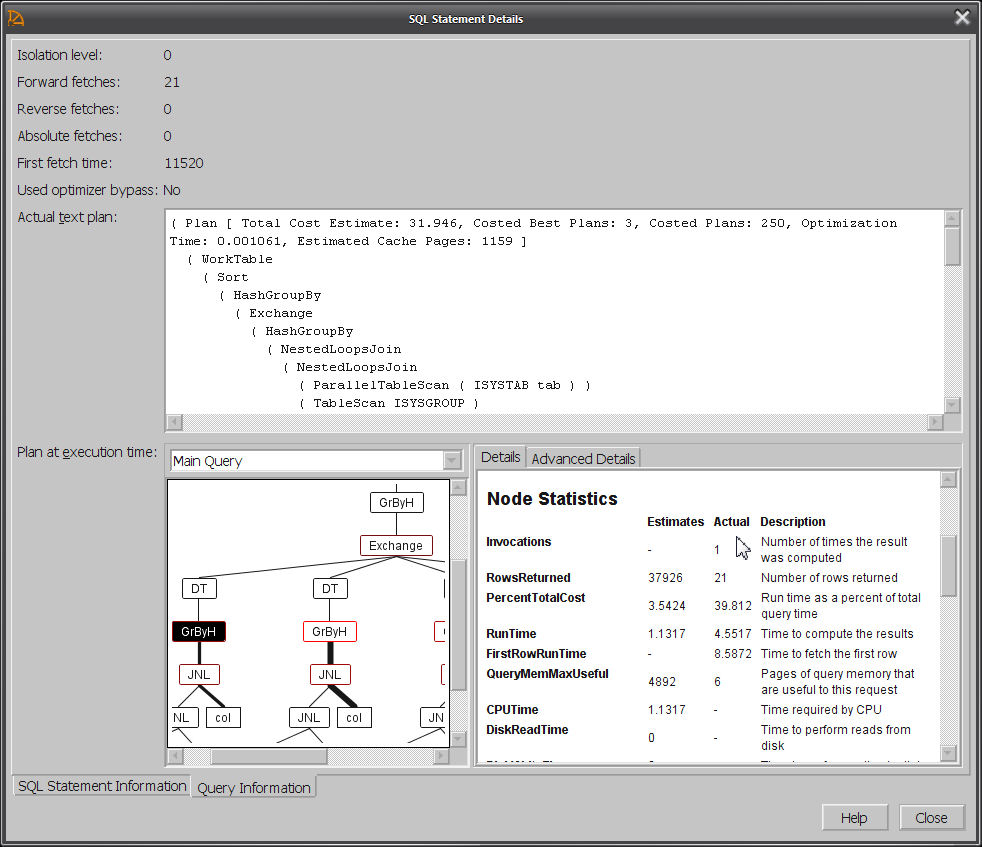
Step 49. Make sure the plan contains both "Estimates" and "Actual" values. If the actual values are missing, you probably didn't choose "plans_with_statistics" back in Step 14.
There's no maximize button on the "SQL Statement Details" window, but you can
- manually resize the window by dragging the borders, and
- manually resize the two panes showing the graphical plan by dragging the divider.
Design Flaw 6: There should be a "Save As..." button on the "Query Information" tab so you can send individual plans to other people. There should also be a "Hide SQL" button. In fact, it's not clear why the ISQL Plan Viewer isn't used here instead of a separate GUI implementation... the Plan Viewer displays all the same stuff and it has a "Save As..." button.
Roll Your Own "Save As..."
Step 50. Take the "Logging session ID" 1 from Step 41 and the "Request ID" 1563 from Step 47, plug them into this query, and run it against your tracing database:UNLOAD
SELECT sa_diagnostic_cursor.plan_xml
FROM dbo.sa_diagnostic_cursor
INNER JOIN dbo.sa_diagnostic_request
ON sa_diagnostic_request.logging_session_id = sa_diagnostic_cursor.logging_session_id
AND sa_diagnostic_request.cursor_id = sa_diagnostic_cursor.cursor_id
WHERE sa_diagnostic_request.logging_session_id = 1
AND sa_diagnostic_request.request_id = 1563
TO 'c:\temp\plan_1563.saplan'
DELIMITED BY ''
ESCAPES OFF
HEXADECIMAL OFF
QUOTES OFF;
The result will be the graphical *.saplan file you can send to other people, and they can open in ISQL Plan Viewer via ISQL - File - Open: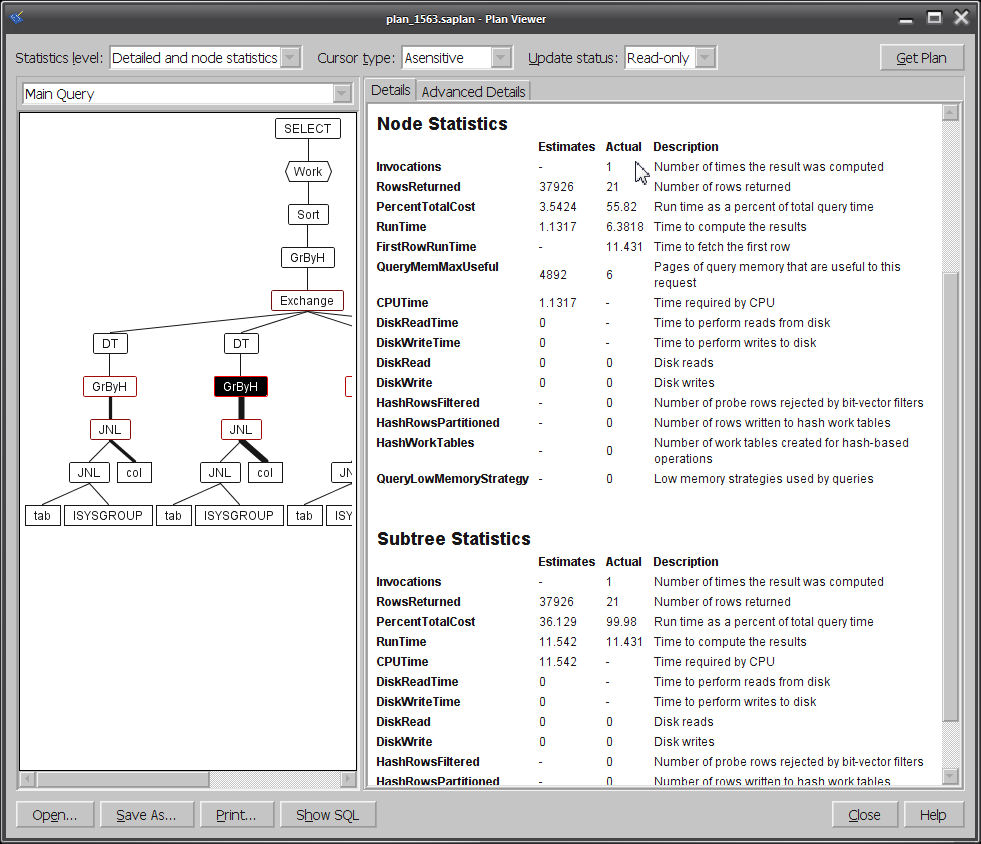
Make sure non-zero numbers appear in the "Actual" column; if they're all zero, it might be because the UNLOAD statement in Step 50 specified the wrong table for the plan_xml column.
And that's it! ...except for some leftovers:
Design Flaw 7: Better, more informative error messages should be produced, rather than "ATTACH TRACING could not connect to the tracing database".
Design Flaw 8: It shouldn't require 50 steps to navigate through Database Tracing on your way to a graphical plan.
Design Flaw 9: The ISQL File - Open dialog box should include "Graphical Plan (*.saplan)" in the file type drop down, along with the current choices "SQL Statements (*.sql)" and "All Files (*.*)".
Database Tracing Schema
Here's the schema for some of the interesting tables in the tracing database, as displayed by Foxhound when you check "Include system tables":-- dbo.sa_diagnostic_statement (table_id 659) in tracing - May 17 2011 9:38:19AM - Print - Foxhound © 2011 RisingRoad
CREATE TABLE dbo.sa_diagnostic_statement ( -- 37 rows, 12k total = 4k table + 0 ext + 8k index
logging_session_id /* PK */ UNSIGNED INT NOT NULL,
statement_id /* PK */ UNSIGNED BIGINT NOT NULL,
database_object UNSIGNED BIGINT NULL,
line_number UNSIGNED SMALLINT NULL,
signature UNSIGNED INT NULL,
statement_text LONG VARCHAR NOT NULL,
CONSTRAINT ASA33 PRIMARY KEY ( -- 8k
logging_session_id,
statement_id )
);
-- Children
-- dbo.sa_diagnostic_query
-- dbo.sa_diagnostic_request
-- dbo.sa_diagnostic_query (table_id 660) in tracing - May 17 2011 9:38:49AM - Print - Foxhound © 2011 RisingRoad
CREATE TABLE dbo.sa_diagnostic_query ( -- 18 rows, 700k total = 8k table + 676k ext + 16k index, 39,823 bytes per row
logging_session_id /* PK FK */ UNSIGNED INT NOT NULL,
query_id /* PK */ UNSIGNED BIGINT NOT NULL,
statement_id /* FK */ UNSIGNED BIGINT NOT NULL,
user_object_id UNSIGNED BIGINT NOT NULL,
start_time TIMESTAMP NOT NULL,
cache_size_bytes UNSIGNED BIGINT NULL,
optimization_goal TINYINT NULL,
optimization_level TINYINT NULL,
user_estimates TINYINT NULL,
optimization_workload TINYINT NULL,
available_requests TINYINT NULL,
active_requests TINYINT NULL,
max_tasks TINYINT NULL,
used_bypass TINYINT NULL,
estimated_cost_ms UNSIGNED INT NULL,
plan_explain LONG VARCHAR NULL,
plan_xml LONG VARCHAR NULL,
sql_rewritten LONG VARCHAR NULL,
CONSTRAINT ASA34 PRIMARY KEY ( -- 8k
logging_session_id,
query_id )
);
-- Parents of dbo.sa_diagnostic_query
-- dbo.sa_diagnostic_statement
-- Children
-- dbo.sa_diagnostic_cursor
-- dbo.sa_diagnostic_optblock
-- dbo.sa_diagnostic_optrewrite
-- dbo.sa_diagnostic_request
-- dbo.sa_diagnostic_cursor (table_id 661) in tracing - May 17 2011 9:39:23AM - Print - Foxhound © 2011 RisingRoad
CREATE TABLE dbo.sa_diagnostic_cursor ( -- 138 rows, 716k total = 8k table + 692k ext + 16k index, 5,313 bytes per row
logging_session_id /* PK FK */ UNSIGNED INT NOT NULL,
cursor_id /* PK */ UNSIGNED BIGINT NOT NULL,
query_id /* FK */ UNSIGNED BIGINT NOT NULL,
isolation_level TINYINT NULL,
flags UNSIGNED INT NULL,
forward_fetches UNSIGNED INT NULL,
reverse_fetches UNSIGNED INT NULL,
absolute_fetches UNSIGNED INT NULL,
first_fetch_time_ms UNSIGNED INT NULL,
total_fetch_time_ms UNSIGNED INT NULL,
plan_xml LONG VARCHAR NULL,
CONSTRAINT ASA35 PRIMARY KEY ( -- 8k
logging_session_id,
cursor_id )
);
-- Parents of dbo.sa_diagnostic_cursor
-- dbo.sa_diagnostic_query
-- Children
-- dbo.sa_diagnostic_blocking
-- dbo.sa_diagnostic_request
-- dbo.sa_diagnostic_request (table_id 662) in tracing - May 17 2011 9:39:50AM - Print - Foxhound © 2011 RisingRoad
CREATE TABLE dbo.sa_diagnostic_request ( -- 1,161 rows, 120k total = 64k table + 0 ext + 56k index, 106 bytes per row
logging_session_id /* PK FK */ UNSIGNED INT NOT NULL,
request_id /* PK */ UNSIGNED BIGINT NOT NULL,
start_time TIMESTAMP NOT NULL,
finish_time TIMESTAMP NOT NULL,
duration_ms UNSIGNED INT NOT NULL,
connection_number /* FK */ UNSIGNED INT NULL,
request_type UNSIGNED SMALLINT NOT NULL,
statement_id /* FK */ UNSIGNED BIGINT NULL,
query_id /* FK */ UNSIGNED BIGINT NULL,
cursor_id /* FK */ UNSIGNED BIGINT NULL,
sql_code SMALLINT NULL,
CONSTRAINT ASA36 PRIMARY KEY ( -- 16k
logging_session_id,
request_id )
);
-- Parents of dbo.sa_diagnostic_request
-- dbo.sa_diagnostic_connection
-- dbo.sa_diagnostic_cursor
-- dbo.sa_diagnostic_query
-- dbo.sa_diagnostic_statement
-- Children
-- dbo.sa_diagnostic_blocking
-- dbo.sa_diagnostic_hostvariable
Email from a developer
August 6, 2012
Breck;
Thanks for the info -- I believe some of this may be of interest as potential additions to your wonderful instructions.
Setting up a tcpip database connection as a Sybase Central connection profile (in this case to localhost 127.0.0.1 using Windows 7 and SQL Anywhere 12); localhost was chosen because it permits me to trace without an internet connection and I am and will not be network sharing the development version of this database.
I believe you mentioned this should be possible but chose other alternatives.
These connections as I have used them only appear to support one database per server and must use different port numbers and should have unique server names:
I completed the identification tab as follows (only tab used)
for the database to be traced (-x tcpip)
   Authentication:    Database
   UserID:            {userid}
   Password:          {password}
   Action:            Start and connect to a database on this computer
   Database File:     {?:\\???\\database.db}
   Encryption Key:    {dbkey if used}
   Database Name:     {database.db}
   Server Name:       {database}
   Start Line:        "dbeng12 -x tcpip(MyIP=127.0.0.1;ServerPort=2638)"
for the tracing database (also -x tcpip / the port choice may not be desirable but it works for me now anyway)
   Authentication:    Database
   UserID:            {userid}
   Password:          {password}
   Action:            Start and connect to a database on this computer
   Database File:     {?:\\???\\tracing.db}
   Encryption Key:    {dbkey if used}
   Database Name:     {tracing.db}
   Server Name:       {database_tracing}
   Start Line:        "dbeng12 -x tcpip(MyIP=127.0.0.1;ServerPort=2639)"
Attempts to create an encrypted tracing database had issues as follows:
ISQL gave me an error for an invalid character near "-" (largely useless to me for debugging with all the "-"s in the command)
DBUNLOAD -c ... -an ... -et -ea AES256 -ek {dbkey if used} -n -k -kdSo I ran DBUNLOAD -c ... -n -k -kd from a command prompt and used reload.sql to populate a manually created database (AES256 WITH KEY)
Where "UID={userid);PWD={password};Server={database};DBN={database.db};DBKEY={dbkey if used};HOST=127.0.0.1:2638"
I believe allowed me to connect to an existing server and open database.
When I entered trace on the oil can both the database.db and tracing.db were already open in Sybase Central and I entered the following into the Save tracing data to an external database entries:
   UserID:    {userid}
   Password:  {password}
   Other connection parameters: Server={database_tracing};DBN={tracing.db};DBKEY={dbkey if used};HOST=127.0.0.1:2639
I have successfully used the tracing database following these instructions.
I hope this information is of interest and if worthy incorporated into your valuable instructions.
I also documented this to remember the "Save tracing data to an external database entries" because they are not completely obvious when you get there and they are not "sticky" either when trace is subsequently restarted.
Thanks
10 comments:
Thanks a lot for your article on the messy subject of tracing/performance tuning in Sql Anywhere.
But even with your detailed article I was soon off track:-(
Maybe becauce we are running our database on Linux or becauce we are using version 12...
I went off track in Step 21. Clik on "Create database" The creation of a tracing database failed:-(
But I found that I created a new database, the new database would containt the tracking system tables!
Then we're back on track, and able got a database trace:-)
Have a few comments to some of the steps:
Step 28. You could se that tracing have been enabled on the
grey "oil drum" wich should have got a red line on it.
Step 37. You will not be able to connect to a tracing database on a PC with Sybase Central only. It would fail with: "A new local server cannot be started because you are running a client-only installation of SQL Anywhere" !
I even found a new desing flaw! (I fear SC got a few for us to discover...)
I wanted to export the most expencive queries to excel so that I could share them with(read: "point fingers to") the developers.
And when I right click the summary tab I got a menu: Copy Data - Cells | Rows | Colums
Looks promising, except that there is no way to select more than one row!
And to make things worse. The copied row would contain comma separated data with headers. BUT the fields does not have any text qualifiers, so if the Statement Text contains a comma....
So now I'm off to mess around with the tracing tables to see if I could get the same information with a query.
Any hints are welcome.
Best regards
Ove Halseth
Although this is an older post, I wanted to sincerely thank you for taking the time to put this guide together. It was extremely helpful navigating through all the pitfalls and un-intuitive nature of getting profiling running on Sql Anywhere.
I come from a MSSQL background and was apparently spoiled by the profiler that was easy to use in realtime with it. While this tracing is nowhere near as convenient, it is already yielding results as we've pinpointed some less than perfect (read: hideous) queries with less than perfect execution plans.
Thanks again!
Thanks for your guide!
I have exactly the same error at step 37 as Vitoc mentioned. Do you know how can it be solved?
Thanks a lot!
Sorry, As Offe mentioned, not Vitoc)
@Eugenia: At the risk of sending you on a circular path, check out this forum conversation: http://sqlanywhere-forum.sybase.com/questions/9469/tracing-databases-how-do-you-connect-to-them
If that doesn't help, post a new question on the forum (not a reply or comment on the old question).
thx for this manual, i do all steps and the profiler works, but have another situation. I want do a profiler on an existen database, but has some errors. first apply this(replacing ddd1 with my database): "%SQLANY11%\bin32\dbeng11.exe" -o dbeng11_log_ddd11.txt -oe dbsrv11_log_fatal_ddd11.txt -x tcpip ddd11.db
I got this error: Cannot access mydata.db: another process may be using the file.
if try to run the profiler wizard, i got this other error: ATTACH TRACING TO LOCAL DATABASE cannot be used with a strongly encrypted database
How can i do profiler with existen database and/or encrypted database?
Thanks 4 any help.
@Cesar: The "Cannot access" message is probably because your database is already running, so don't bother to run dbeng11.exe again.
The "cannot be used" message is described in the Help: http://dcx.sybase.com/1101/en/saerrors_en11/errm1088.html
Is this still current for Sybase 17? Thanks!
ZinkBlog asked "Is this still current for Sybase 17?"
Apparently some bits and pieces of "database tracing" or "diagnostic tracing" still exist in SQL Anywhere 17 but the GUI is gone from SQL Central; see https://help.sap.com/viewer/61ecb3d4d8be4baaa07cc4db0ddb5d0a/17.0/en-US/818db6796ce210149efba076ca00a476.html?q=diagnostic%20tracing
See the completely separate (and brand new) SQL Anywhere Profiler https://help.sap.com/viewer/61ecb3d4d8be4baaa07cc4db0ddb5d0a/17.0/en-US/818d51946ce210149d07e769522b030a.html?q=sql%20anywhere%20profiler
Post a Comment