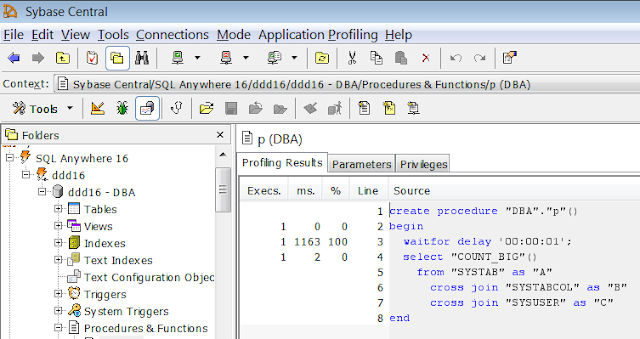
When using the procedure profiler in SQL Anywhere, it is easy to miss long-running queries that build the result sets returned by stored procedure calls. The code for these queries is located inside the stored procedure, but the procedure profiler reports the time spent executing them as zero.
Here's a simple stored procedure with two "hot spots" that take a long time to run, the WAITFOR and the SELECT COUNT_BIG(*):
Tip: Here's how to launch the SQL Anywhere 16 procedure profiler in Sybase Central:
To see the profile results:
- Connect to the target database.
- Click on the Mode menu item, then
- click on Application Profiling.
- The Application Profiling frame will appear at the bottom of the window.
- Check Stored procedure, function, trigger, or event execution time, then
- click Finish.
- The Profiling Stored Procedures, Function, Triggers, and Events display will appear.
To stop profiling:
- Run your tests,
- click on View - Refresh All, then
- look in the Profiling Results tab.
- Look in the Profiling Stored Procedures, Function, Triggers, and Events display, then
- click on the Stop Collecting Profiling Information on Selected Databases.
ISQL says the SELECT * FROM p() ran for 14.39 seconds; here's what the procedure profiler says about the call to p():
CREATE PROCEDURE p()
BEGIN

WAITFOR DELAY '00:00:01';

SELECT COUNT_BIG(*)
  FROM SYSTAB AS A
       CROSS JOIN SYSTABCOL AS B
       CROSS JOIN SYSUSER AS C;

END;

SELECT * FROM p();

COUNT_BIG()
66452736

Execution time: 14.39 seconds

14.39 seconds versus 1165 milliseconds? How can that be?
Where did the other 13.2 seconds go?
Not anywhere inside p(), at least not according to the procedure profiler:

As expected, 1163 milliseconds are reported against the WAITFOR DELAY '00:00:01' statement, but only 2 milliseconds for the SELECT... it might as well say "zero".
Maybe it's ISQL's fault
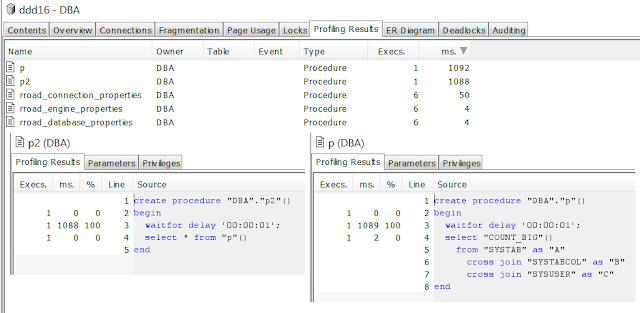
The procedure profiler doesn't look inside client applications, and that's what ISQL is: a client application running the SELECT * FROM p() statement. So let's push that SELECT down inside another stored procedure p2() and call that one from ISQL:Here's what the procedure profiler has to say about p2() and p()... each one has a WAITFOR that takes about one second, but neither SELECT takes any time at all:

The bottom line is...
You cannot trust the procedure profiler to report the time spent executing SELECT statements that return result sets from stored procedures.However, you can check those SELECT statements yourself, by going Old School with DATEDIFF() and MESSAGE:
Here's what the MESSAGE statement wrote to the SQL Anywhere diagnostic console log:
CREATE PROCEDURE p()
BEGIN
DECLARE @t TIMESTAMP;

WAITFOR DELAY '00:00:01';

SET @t = CURRENT TIMESTAMP;
SELECT COUNT_BIG(*)
  FROM SYSTAB AS A
       CROSS JOIN SYSTABCOL AS B
       CROSS JOIN SYSUSER AS C;
MESSAGE STRING ( 'SELECT result set: ', DATEDIFF ( MILLISECOND, @t, CURRENT TIMESTAMP ) ) TO CONSOLE;

END;

CALL sa_flush_cache();

SELECT * FROM p();

COUNT_BIG()
66452736

Execution time: 12.522 seconds
Now you know where the time is going, you can determine why by using the technique described in Capture Plans With GRAPHICAL_PLAN().
No comments:
Post a Comment